12 Important Candlestick Patterns to Know
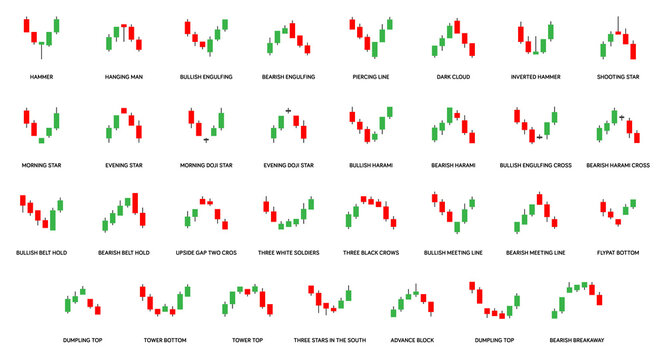
The other day we did an article that provided you with all of the most basic information that you need to know about Candlestick charts. However, what we want to do today is to provide you with information about the 12 most important Candlestick patterns that you need to know. These are the most common Candlestick patterns that you are going to run across when using these charts, so you better know what they mean.
Reading Candlestick Charts
Before we get to taking a look at the 12 most important candlestick patterns that you need to know about, let’s just provide you with a quick crash course on candlestick charts. What you need to know is that these Candlestick charts are a visual representation of the emotion and sentiment that a market is currently going through.
In other words, it’s a good indication of whether a bullish market or a bearish market is currently a current, and moreover it’s also a very good indication if there is a bullish reversal or a bearish reversal armor horizon. Let’s also keep in mind that the two most important components of the candlestick are the body and the wicks, also known as the shadows.
If you know how to read both the shadows and the bodies of candlesticks in relation to the other candlesticks on the chart, then you will be able to see the patterns that we are about to discuss. Of course, placing profitable trades is all about being able to spot these various Candlestick patterns.
Six Bearish Market Candlestick Patterns
What we want to do first is to take a look at the six most common bearish candlestick patterns. Keep in mind that these are candlestick patterns that indicate that prices will go from being in an uptrend into a downtrend. Bearish candlestick patterns occur at the end of uptrends and signify that a downtrend is on the horizon. Let’s take a look at the six most common bearish candlestick patterns that indicate that a downtrend is about to happen.
The Hanging Man
One of the most common bearish candlestick patterns that you will ever run into is called the handing them. This candlestick pattern has the same shape as the bullish hammer, but it forms at the end of an uptrend instead of at the end of a downtrend. This is a pattern that signifies that there was powerful selling during the day, but then buyers were then able to push the price back up. The large sell off during the day is usually seen as an indication that bulls are losing control of the market.

Dark Cloud Cover
The dark cloud cover bearish candlestick pattern features 2 candlesticks, a red one that opens above the previous green body, and also closes below the midpoint of the previous green candle. This generally indicates that the bears have taken over the market, and that the price is being pushed lower and lower. Keep in mind that if the shadows of the panels are extremely short, which indicates that the next downtrend will be strong.

The Evening Star
Another bearish candlestick pattern that you need to know about is the evening star. This is the equivalent of the bullish Morningstar. This is a candlestick pattern that consists of three separate candles, and it sees a short candle that is stuck between a long green candle and a long red handle. This is an indication that a reversal of an uptrend is occurring, and it is a particularly strong sign when the third candle erases all of the gains that were made by the first handle.

Three Black Crows
The next bearish candlestick pattern that you need to know is called the three black crows pattern. Here you will see three very long red candlesticks, all of which have either no shadows or very short shadows. Keep in mind that each of these sessions will usually always open at a similar price to the previous day, but massive selling pressure then pushes the price lower with each of the closes. This is a very strong sign that a bearish downtrend is on a rising.
Bearish Engulfing
When it comes to bearish candlestick patterns, the bearish engulfing pattern is actually one of the most common. This usually always happens at the end of an uptrend. It is characterized by a candle that has a very small green body, which is then completely engulfed by a much larger red candle that follows. this is a sign that there is a peak or slowdown of price movement, and that there is a down trend on the horizon. Keep in mind that the lower the second candle’s position is, the stronger this you downtrend is going to be.

The Shooting Star
The 6th and final of the bearish candlestick patterns that you need to know is the shooting star. This is the bearish equivalent of the bullish inverted hammer. This candlestick pattern forms at the end of an uptrend and here you will see a red candle with a small lower body along with an upper wick. Here you will also usually see that the market has a gap that is slightly higher on the opening, but will then rally to an intraday high, before then closing at a price that is just slightly above the opening.

Six Bullish Market Candlestick Patterns
Now that we have figured out what the six most common bearish candlestick patterns are, let’s figure out what the six most common bullish candlestick patterns are. Remember that these particular Candlestick patterns is usually always format the end of a downtrend, and they signify that an uptrend is about to happen.
Bullish Engulfing
The bullish involving pattern is one of the most common Candlestick patterns out there that indicates that a bullish market is on the horizon. Here you will see two candlesticks, with the first one having a short red body, which is been completely engulfed by a green candle that is much larger. The second day usually opens lower than the first day, but the bullish market then pushes the price upwards.

The Hammer
Another one of the most common bullish candlestick patterns out there is known as the hammer. Here you will see a green candle that has a short body and a long lower shadow. This is generally always found at the bottom of a downtrend, and there are usually always other green candles following it. This hammer usually always indicates that there was strong selling pressure throughout the day, but at the end of it all, strong buying pressure managed to drive the price back up.

The Inverse Hammer
The inverse hammer also known as the inverted hammer, is a very similar bullish candlestick pattern to the other one that we just looked at. Here you will see a green candle that has a short body with a long upper shadow, combined with a short lower shadow. The inverted hammer Candlestick pattern indicates that strong buying pressure was then followed by strong selling pressure, but the selling pressure was not strong enough to drive the market price back down. This is a very strong indication that buyers will have control of the market in a short amount of time.

Three White Soldiers
Yet another one of the most common bullish candlestick patterns is known as the three white soldiers. This is a very simple Candlestick pattern that consists of three very long green candles, all of which have small Wicks and they all open and close progressively higher than on the previous day. This is one of the strong ballistic patterns out handles to both there, and it always occurs after a downtrend, and it shows that there is a steady advance of buying pressure.

The Morning Star
Another very common bullish candlestick pattern is the Morningstar. The morning start usually happens at the end of a big market downtrend, and it’s a pattern that consists of three candles. Delete you will see a candle with a very short body that sits between a long red candle and a long green candle. Generally speaking, the middle candle will not have an overlap with the longer bodies, which is because the market gaps both on the open and the close. This pattern usually signifies that the selling pressure from the first day is reducing, and that there is a bull market on the horizon.

The Piercing Line
The 6th and final of the bullish candlestick patterns that we want to take a look at is known as the piercing line, and it’s made up out of one long red candle that is followed by a long green candle. One of the defining features here is that there is usually always quite a large gap between the cloud closing price of the first candle and the opening price of the next candle. This is a strong indication that there is strong buying pressure because the price is being pushed upwards either to the mid price of the previous day or above it.

Trading with Candlestick Patterns – Final Thoughts
There are of course many other Candlestick patterns out there, although the ones we talked about today or the six most common bearish and the six most common bullish candle stick patterns. If you know what these patterns mean, then your life will be much easier, and you will be able to start placing many more profitable trades on a consistent basis.
If you need help day trading, and what you need is a comprehensive education, particularly on Forex trading, then the best place to be is the Income Mentor Box Day Trading Academy. At this time, the IMB Academy is the most comprehensive, user friendly, effective, and affordable Forex trading school out there.
CLICK BELOW TO JOIN INCOME MENTOR BOX AND START MAKING REAL PROFITS!