Best Price Action Trading Strategies
Price action trading is a great way for both newbies and experienced traders to make money. This is true for all sorts of markets, whether Forex, stocks, commodities, crypto, or anything in between. For those of you who don’t know, price action trading is all about using very naked or stripped down versions of charts to make trading decisions.
For one, this means that PAT does not utilize lagging indicators, besides the odd moving average. All markets create and display data about past prices and price movements, which is then displayed on a chart. The charts, referred to as price charts, reflect the beliefs and actions of all market participants over a specified period of time, and these actions are displayed on the price chart of a market in the form of price action.
Something important to note before we get into talking about specific price action trading strategies is that candlestick patterns charts are very important here. For many people, candlesticks are the best and easiest type of chart to read. Candlestick charts are just very simple. Therefore, today’s price action trading strategies are going to revolve around candlestick charts. Sure, you can use other graphs and charts too, but candlesticks do tend to make life a whole lot easier.
Price Action Trading Strategies
Right now, we want to take a closer look at a few popular price action trading strategies that involve using candlestick patterns and candlestick charts.
For those of you who are unfamiliar, you might also want to first brush up on some market basics, such as what a bullish market is and what a bearish market is.
This may get a little confusing, because these price action trading strategies are based directly off of specific candlestick patterns, and each candlestick patterns leads to a different price action trading strategy.
Right now, we want to take a closer look at 3 specific candlestick price action strategies or patterns that can help you trade.
We want to take a look at the bullish hammer price action candlestick pattern, the bearish shooting star candlestick, and the harami price action pattern, which depending on the situation, may be either bullish or bearish.
The Hammer
One thing to look out for is the hammer price action trading strategy, which is a bullish signal that shows a high probability of the market moving higher rather than lower. This is seen primarily in markets trending upwards.
A hammer shows that sellers are pushing the market to new lows, but it also shows that the sellers are not strong enough to stay at the low and bailed on their positions. In the hammer, the open and close prices should both be in the upper half of the candle. Generally, the close can be lower than the open, but the signal is stronger if the close is above the opening price.
An example of a good entry point for a trade here is when the next candle manages to break past the high of the hammer candle. A trade like this can be closed using support and resistance levels, or even with trailing stop loss levels as well.
/hammercandlestick-5c620b2ac9e77c0001566ce8.jpg)
The Shooting Star
Another thing to look out for here is the shooting star price action pattern. Unlike the hammer, which is a bullish signal, the shooting star is a bearish signal, one that signifies a high probability of the market moving lower rather than higher. It is used and shown mostly in markets that are trending downwards. In layman’s terms, the shooting star is more or less the exact opposite of the hammer.
A shooting star price action pattern shows that the buyers are pushing the market to new highs, but at the same time, the buyers are not strong enough to stay at the high and choose to close their positions. This then causes the market to drop, thus also leading sellers to enter the market at higher rates.
Both the open and close prices should be in the lower half of the candle. Generally speaking, the close can be higher than the open, but the signal is stronger is the closing price is below the opening price.
A good place to enter the market when this pattern occurs is when the market manages to break the low of the shooting star candle. Once again, using support and resistance or trailing stop losses to exit this trade are possibilities open to you.
:max_bytes(150000):strip_icc()/shootingstar-5c5c61a946e0fb0001849c01.jpg)
The Harami
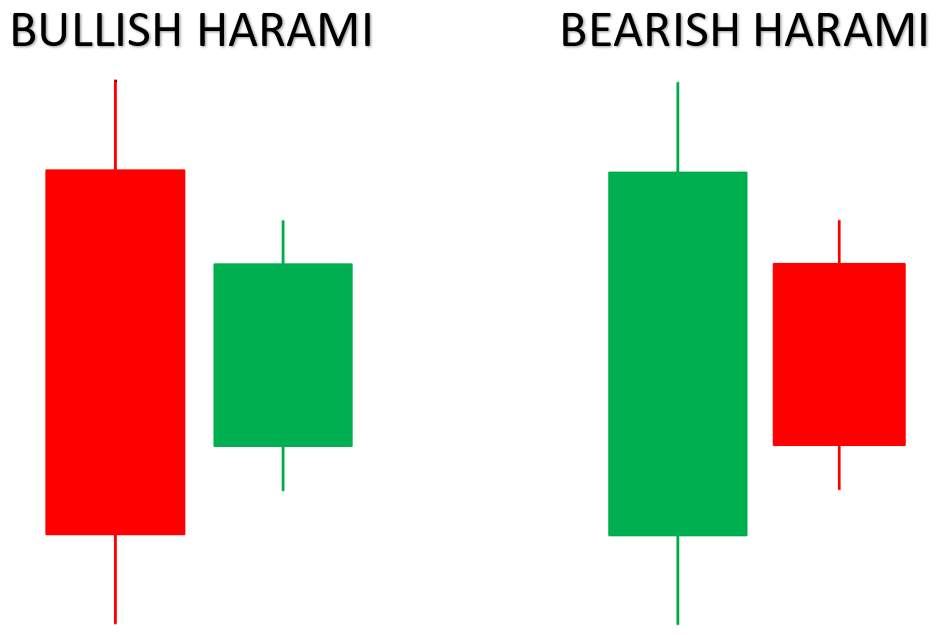
The harami price action pattern is a pattern that consists of two candles, and this represents market indecision. This is mostly used in breakout trading. This is sometimes also called an inside candle formation, because one candle usually forms inside the range of the previous candle’s range, or within both the high and the low.
What is interesting to note is that while the hammer is a bullish signal and the shooting star is a bearish signal, the harami pattern can be either bullish or bearish. The bullish harami price action pattern forms when a candle for buyers has a high to low range that develops within the high to low range of the previous seller candle. The point here is that because there is no continuation to form a new low, the bullish harami pattern shows market indecision which can lead to an upward breakout.
On the other hand, you have the bearish harami price action pattern, which is when a seller’s candle range of high to low develops within the high to low range of the previous buyers’ candle. The point here is that because there is no continuation to form a new high, the bearish harami pattern shows market indecision which can lead to a downward breakout.
Price Action Trading Strategies for Beginners
If you need a refresher course on what price action is, please refer to our previous posts on the matter. The fact of the matter is that price action trading is reliable and easy, particularly when you are using candlestick graphs to analyze the data.