Candlestick Patterns Explained with Examples
Last week, we did a really informative introduction to candlestick patterns, the basics, what they are, and more. For those of you who don’t remember, candlestick patterns are a big part of technical analysis in trading, and they can be used for stocks, Forex, and more.
The definition is “a candlestick pattern is a movement in prices shown graphically on a candlestick chart that some believe can predict a particular market movement”. These patterns are all about predicting possible future price movement based on previous prices and movements.
Now, in the previous article about this topic, we provide you with a basic explanation of this topic and how these patterns work. Today, we want to provide you with a list of the most common and useful candlestick patterns explained with examples. Let’s get right to it and take a look at the most common ones!

Candlesticks Explained with Examples
Before we get into providing you with our little candlestick patterns cheat sheet, we do want to make a distinction between bearish and bullish candlesticks. Simply put, a bullish market is one where people believe that the price of a stock, asset, or currency pair will increase.
On the other hand, a bearish market is one where people believe that the price of a stock, asset, or currency pair will decrease in price. Therefore, there are bullish candlestick patterns and bearish patterns too. Let’s take a look at the most common ones in both categories.
Bullish Candlestick Patterns
Let’s start off by taking a look at some of the most common bullish candlestick patterns that may form after a market downtrend. These signal a reversal in price movement, thus providing traders with good opportunities to open long positions to profit from the upward movement of a price.
Three White Soldiers
The most important thing to know here is that the three white soldiers pattern is one that occurs over the course of three days. Here, you will see consecutive long green candles (or white candles), all with small wicks, which may progressively open and close higher than the previous day. This is an extremely strong bullish pattern which happens after a downtrend. It shows a steady increase in buying pressure.
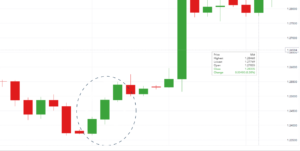
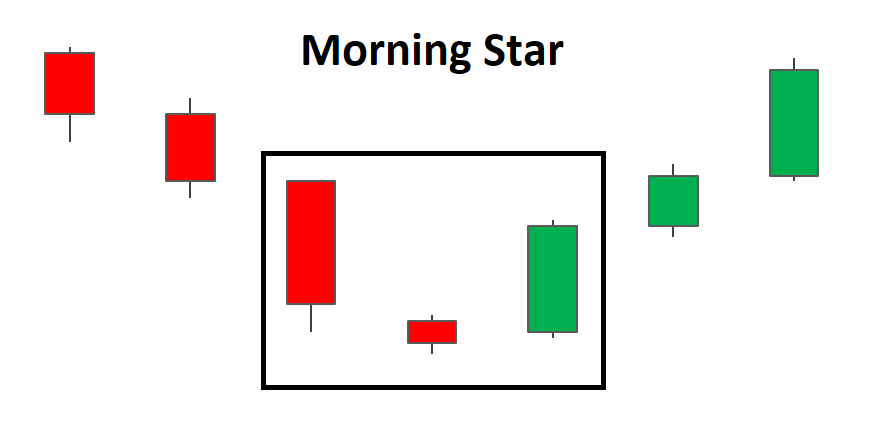
Morning Star
The morning star is often seen as a sign of hope during a downtrend in the market. This is a pattern which consists of three candlesticks. There is a single candle with a short body that is located between a long red candle and a long green candle. Generally speaking, the star or the short candle will not overlap with either of the longer candles, due to the market gapping on both the open and close. This candlestick pattern signals that the selling pressure seen on the first day is subsiding, and that there is an emerging bull market.
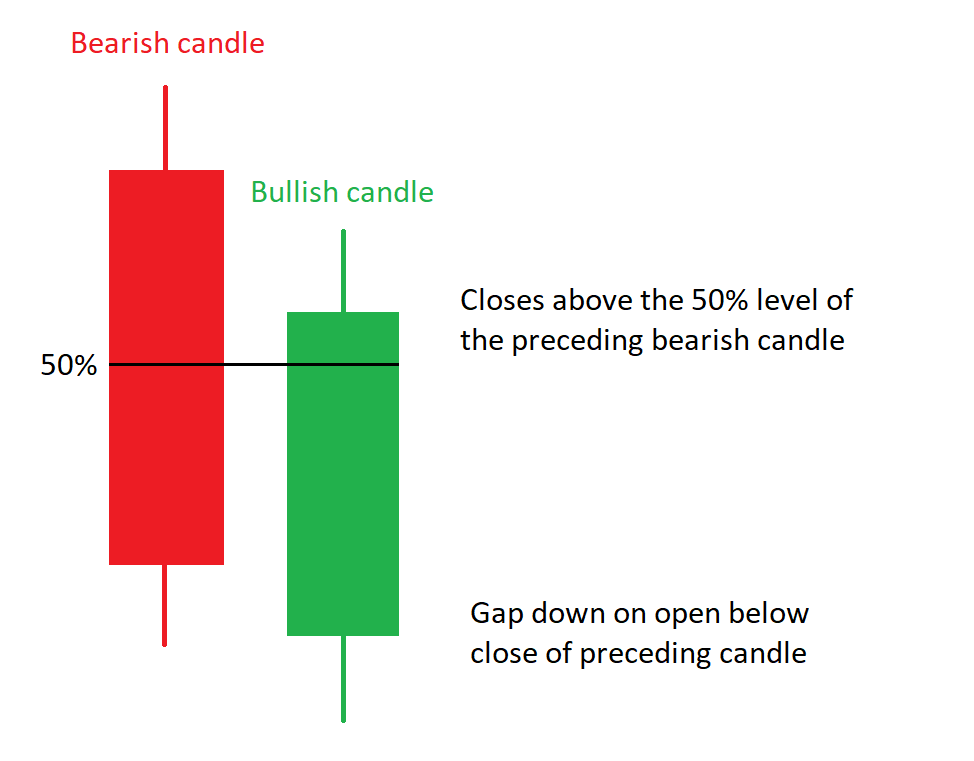
Piercing Line
The piercing line candlestick pattern is a two stick pattern, and it consists of a long red candle, followed by a long green candle. Generally speaking, there is quite a gap between the closing price of the first candlestick and the opening price of the green candlestick. This pattern indicates that there is fairly strong buying pressure as the price gets pushed up to or above the mid-price of the preceding day.
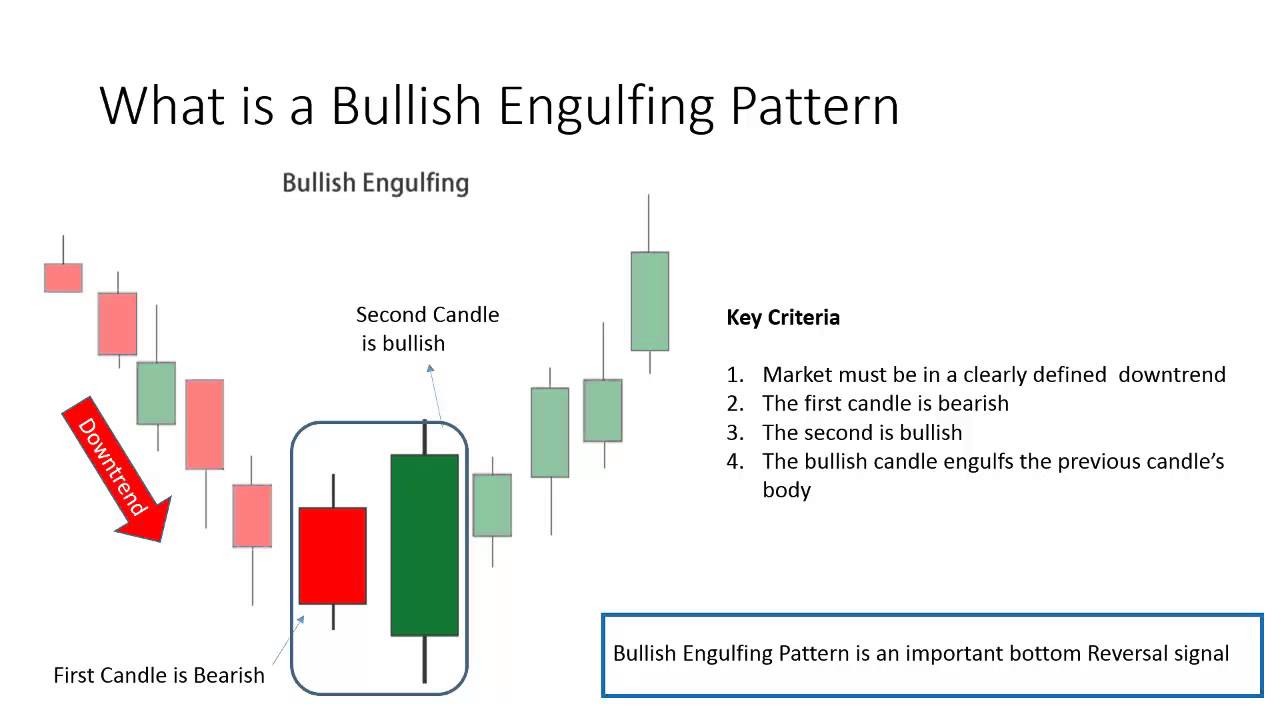
Bullish Engulfing
The bullish engulfing pattern is another two stick pattern, one that consists of a short red candle with a body that is totally engulfed by a larger green candle. Although the second day opens at a lower price than the first day, the bullish market pushes the price upwards, thus providing buyers with good trading opportunities.
Bearish Candlestick Patterns
Bearish candlestick patterns generally form after an uptrend in the market, and they tend to signal a point of resistance. In other words, strong pessimism about the price of the market forces traders to close long positions, and therefore to open short positions to take advantage of falling prices. Let’s take a closer look at some of the most common bearish candlestick patterns out there.
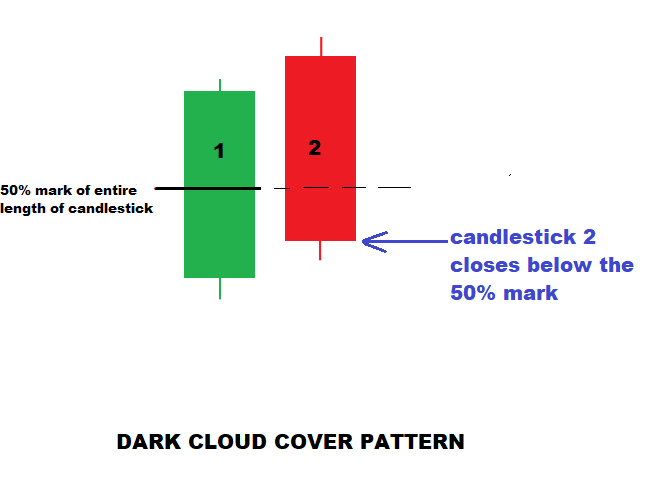
Dark Cloud Cover
The dark cloud cover pattern indicates that a bearish reversal is on the horizon, like a dark cloud hanging over the optimism of the previous day. This is a two candle pattern that consists of a red candlestick that opens above the previous green body, and closes below the green candle’s midway point. This pattern signals that the bears have taken over the market, thus pushing the price lower. If the candle’s wicks are very short, this indicates that there was a very decisive downtrend.
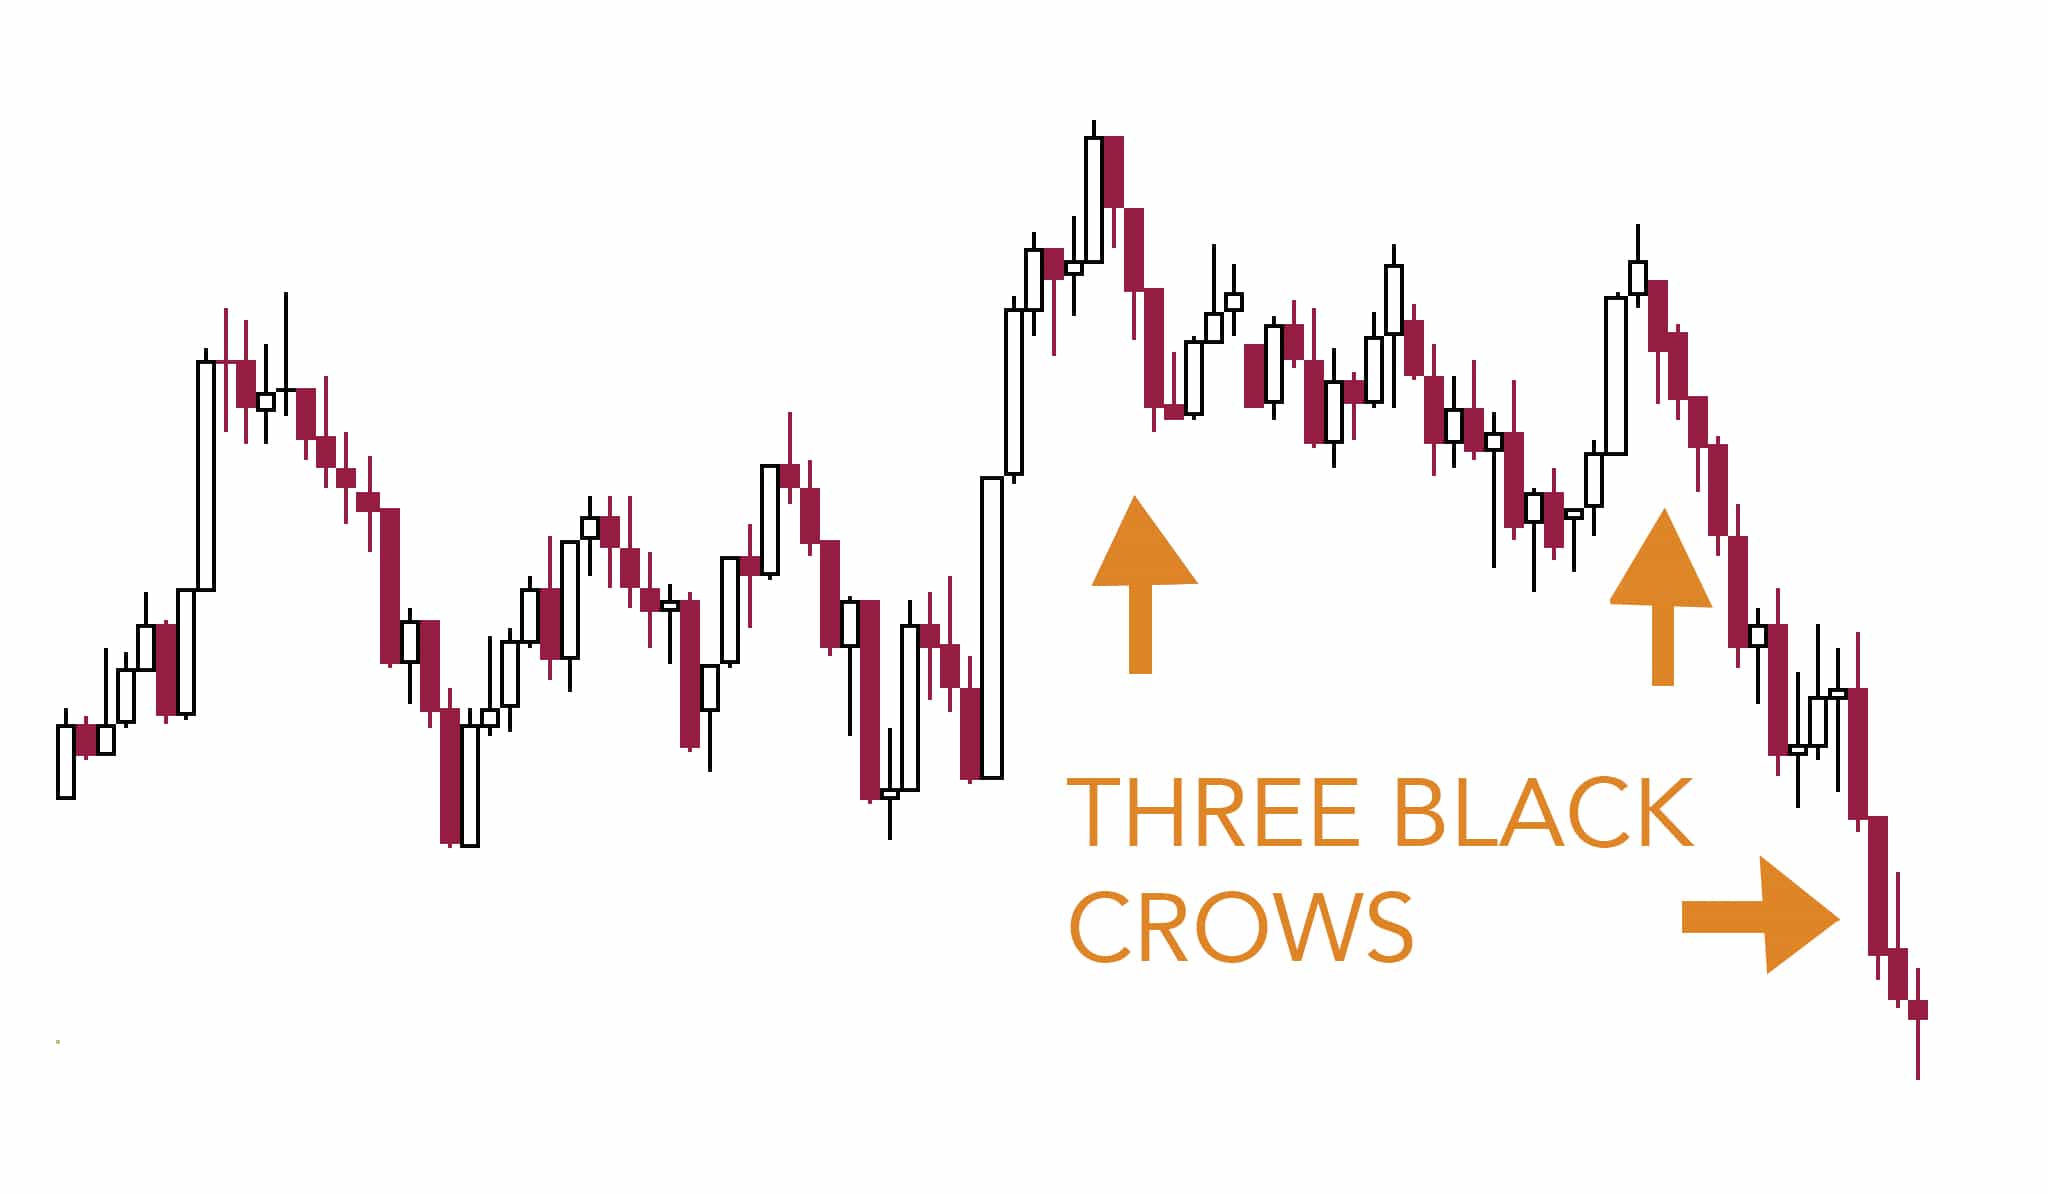
Three Black Crows
The three black crows pattern is formed by three consecutive red candles with long bodies, with short wicks or no wicks at all. Each session appears to open at a very similar price to the previous day, but pressure from sellers pushes the price lower with each close. Traders usually interpret the three black crows pattern as the beginning of a bearish trend, because sellers have taken over the market from buyers.
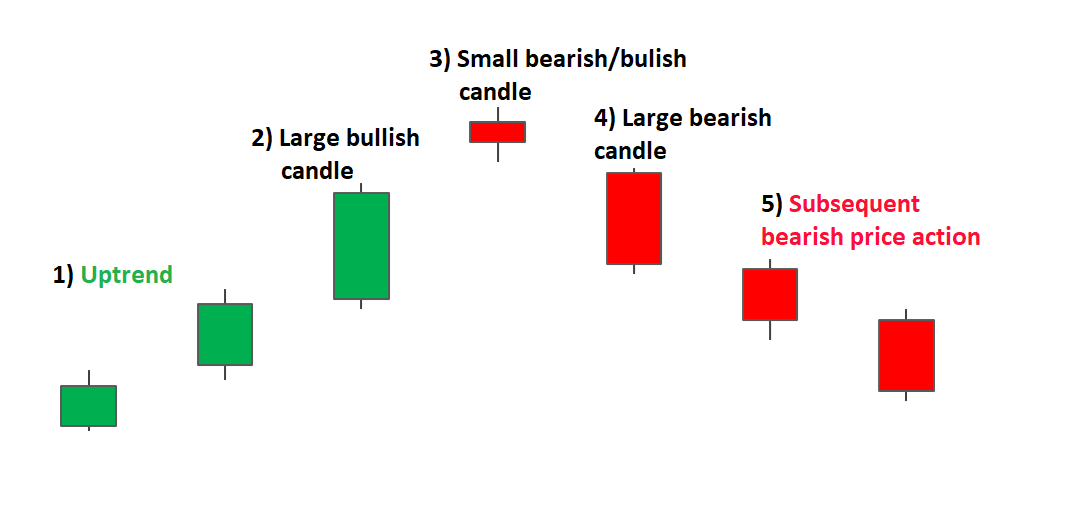
Evening Star
The evening star is another one of the candlestick patterns that consists of 3 candles. This pattern consists of a short green candle in between a long green candle on one side and a long red candle on the other side. This pattern indicates that there is a reversal in the uptrend in the works. This pattern is particularly strong when the third candle cancels out the gains made by the first candle.
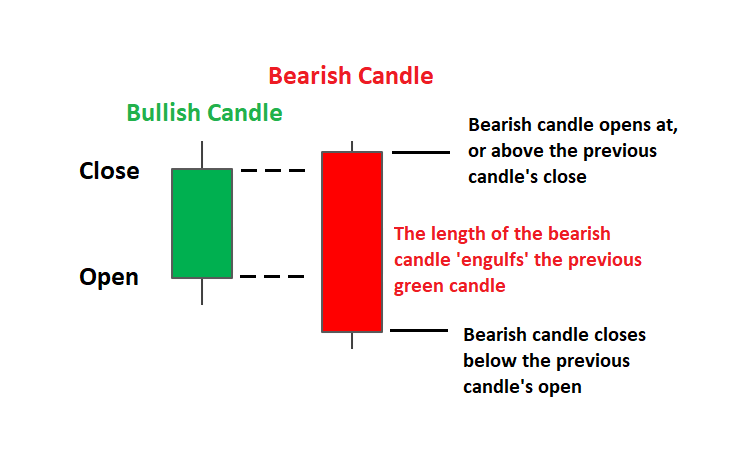
Bearish Engulfing
The bearish engulfing pattern generally occurs near the end of a market uptrend. This is a two candle pattern that consists of a small green candle that is totally engulfed by a long red candle. This indicates a peak or a slow down in upward price movement. The lower the second engulfing candle goes, the stronger the trend will be.
Candlestick Patterns Explained with Examples – Final Thoughts
No, these are not the only candlestick patterns that you should be familiar with, but they are some of the most common ones. Stay tuned for more, because in the coming days and weeks, we will be covering candlestick patterns in increasing detail.