Identifying Bullish Candlestick Patterns
Being a profitable trader is much easier said than done. One of the most important aspects of trading is technical analysis. In terms of technical analysis, one of the most useful tools out there is the Candlestick chart. Candlestick charts are great technical analysis tools that allow you to gauge when and where to enter a trade. Specifically, candlestick charts are excellent for identifying both trends and especially trend reversals.
With that being said, you do first need to know how to read candlestick charts. There are a few different aspects of these candlesticks that you need to be aware of in order to make sense of what you see in front of you. Moreover, you also need to be aware that there are both bullish and bearish candlestick patterns. Bullish candlestick patterns signify that the bearish trend is coming to an end, and that there is a bullish reversal on the horizon.
What we are here to do today is to provide you with a crash course on identifying bullish candlestick patterns. We first want to provide you with some basic information about candlesticks, and then take a look at the five most common bullish candlestick patterns out there. Once you know these Candlestick patterns, you should become a much more proficient trader that is able to make profits on a consistent basis.
How to Read Candle Charts
Candlestick charts have been around for well over 100 years and they were invented in Japan. They have been used in western trading for over a century, and they are still very useful to this day. A candlestick chart provides you with four valuable pieces of information, which include the open and the closing price of a security, as well as the highest and the lowest price that it was traded at during any given day.
In terms of the structure of candlesticks, the main part of the candle, the rectangular part, is known as the real body, in this provides you with information about the closing and the opening prices. This real body of the candle provides you with the price range between the open and the close for a particular day.
If the real body of the candle is filled in, red, or black, it is a sign that the closing price is lower than the opening price, and this is usually seen as a bearish candle. It is a strong sign that the price opened with the bears then pushing the price down causing the price to close at a lower value than it opened at.
On the other hand, if you see a candle that has a real body which is empty, green, or white, it is a strong indication that the closing price was higher than the opening price, and this is what we know to be a bullish candle. This is a strong indication that the price opened, with the bulls then pushing the price upwards, therefore causing it to close at a higher value than it opened at.
The other thing that you need to know about candlesticks has to do with those small vertical lines at both the top and the bottom of the real bodies, which are known as the Wicks or the shadows. These wigs are shadows provide you with information about both the lowest and the highest price that an asset was traded at during a specific date. As far as these bullish candlesticks are concerned, remember that they are usually always green, and they represent upward strength.

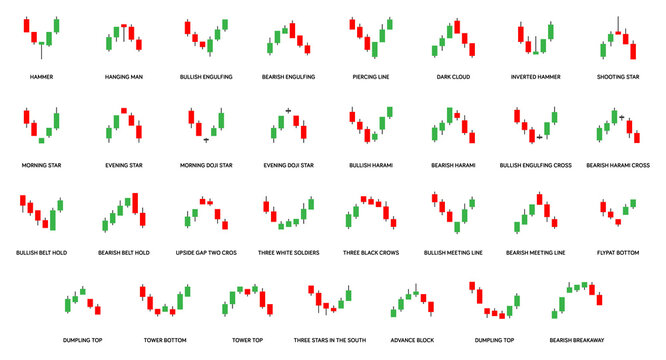
The Five Most Common Bullish Candlestick patterns
Now that you know the basics of candlesticks, let’s take a closer look at the five most common bullish candlestick patterns that you need to know.
CLICK ON IMAGE TO GET CRYPTO SIGNALS!

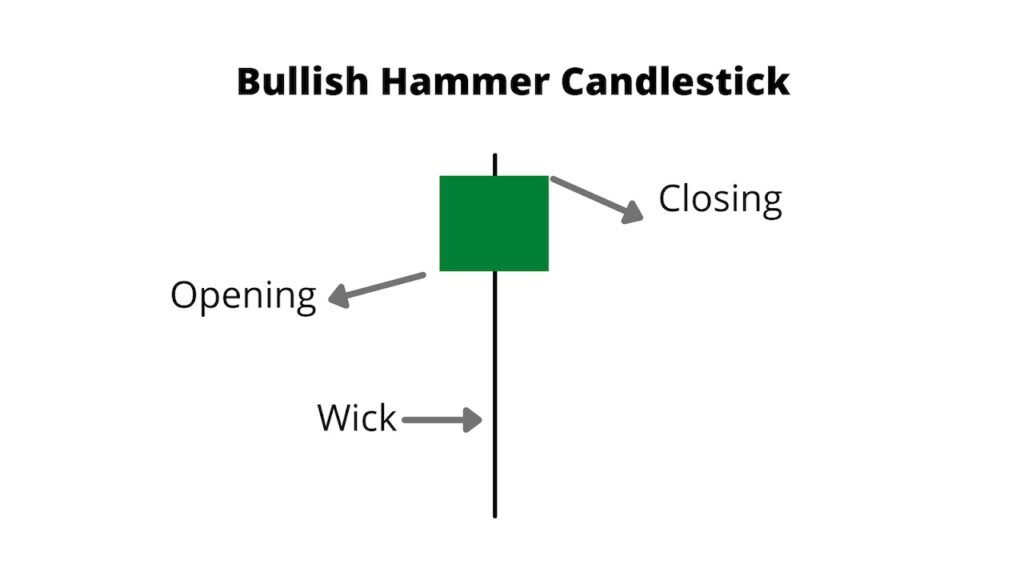
The Bullish Hammer
Perhaps the most common bullish candlestick pattern that you will come across is known as the hammer. This always forms at the end of a downward trend and it is a sign that a bullish reversal is happening. here you will see a very short green candle that has a very long Wick, with the lower Wick being about twice as long as the candle itself, and it also doesn’t have an upper shadow.
This pattern indicates that the price opened fairly high, with sellers pushing the price down, but then buyers coming in is pushing the market price back up. The result is that the trading price closed higher than it was at the open. This is an indication that there is a strong buying pressure on the market.
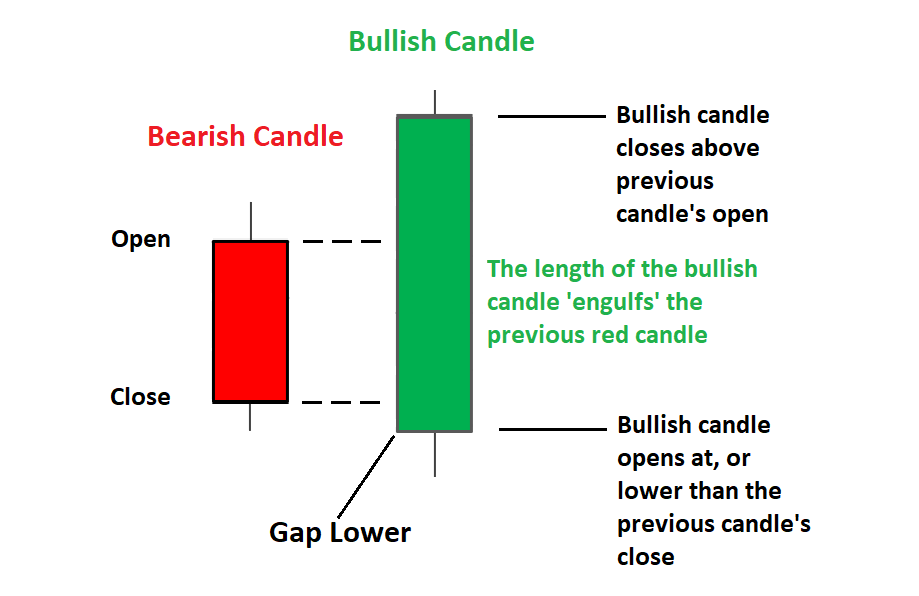
Bullish Engulfing
The second common bullish candlestick pattern out there is known as bullish engulfing, and it is formed by multiple candlesticks at the end of the downtrend, and of course also signifies that an uptrend is in the works. ‘
Here, you will see two separate candles, with a second candle completely engulfing the first candle, and of course, the first candle is a bearish one, with the second one being a bullish one. This shows that their bulls are in the market and that there is a strong buying pressure.
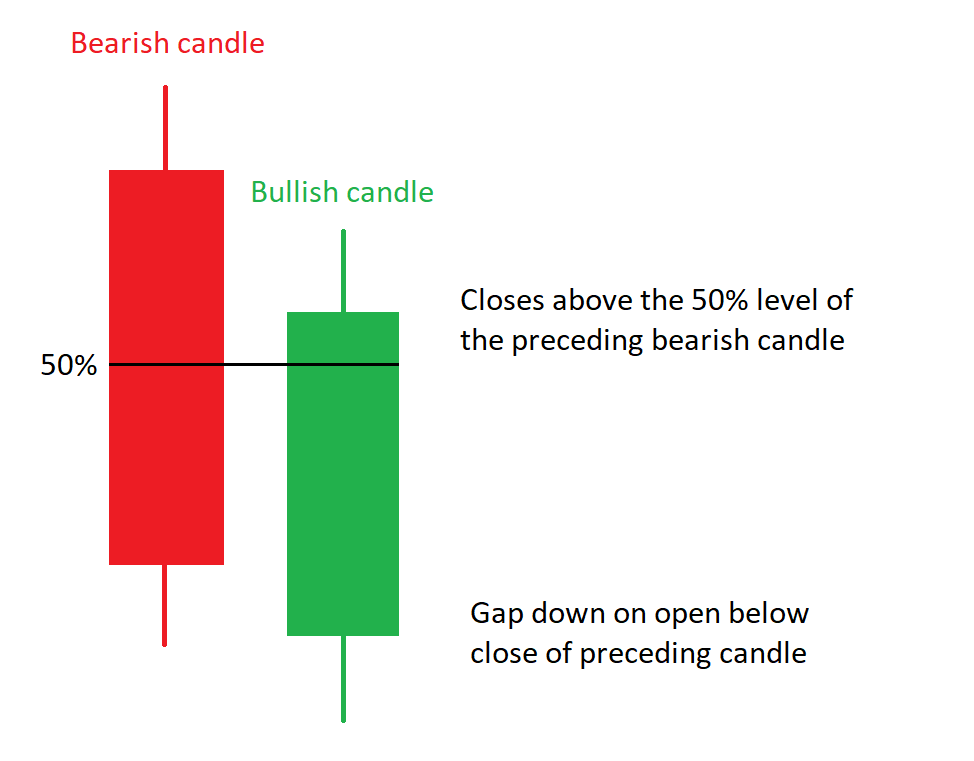
Bullish Piercing
The third common bullish candlestick pattern out there is known as the bullish piercing Candlestick pattern. This of course also forms at the end of a downtrend.
This pattern also consists of two candles, with the first one being a bearish one, and the second one being a bullish one period the second candle opens gap down, but the close is more than 50% of the real body of the previous candle. It’s another sign that a bullish reversal is in the works.
Three White Soldiers
We then have the three white soldiers pattern, which as you can tell, consists of three separate candles. Here, you will see that each candle has a long bullish body, and his colored green. These don’t have any long shadows, and each candle opens about halfway above the opening price of the previous candle. This is one of the strongest indications that a bullish reversal is happening.

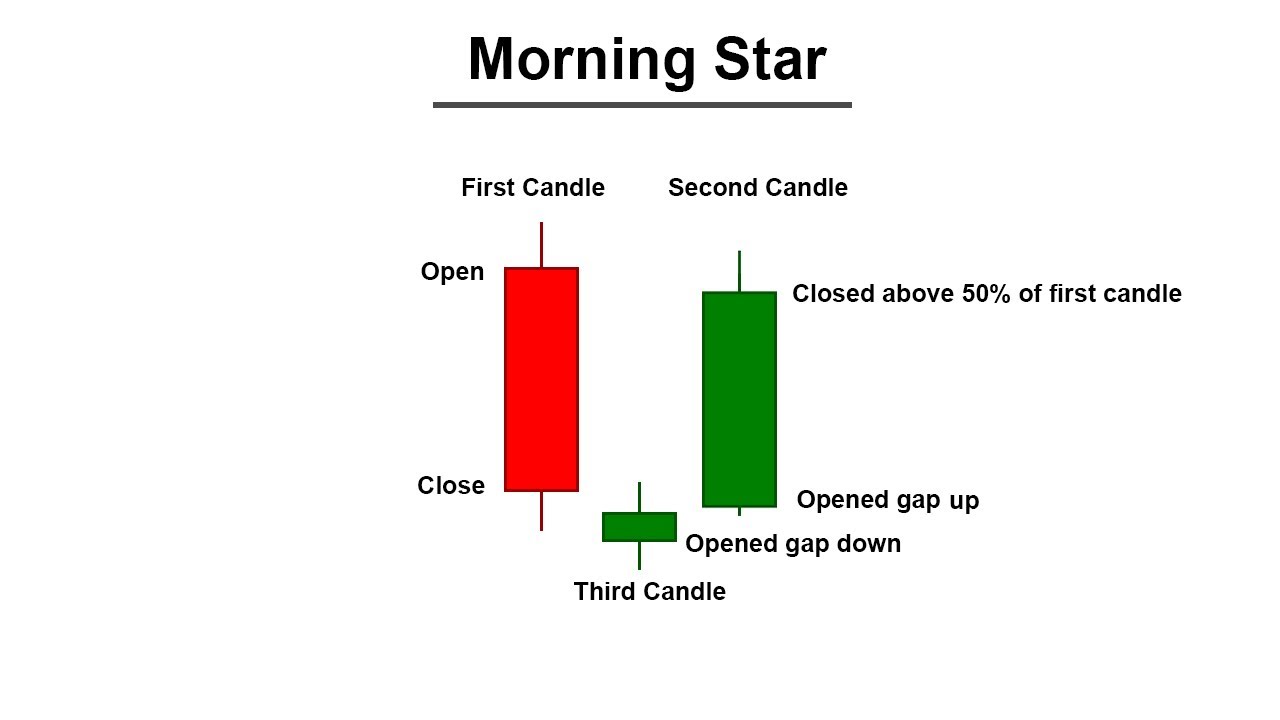
Morning Star
The fifth bullish candlestick pattern that we want to take a look at is known as the Morningstar pattern. Here you will see three different candles, with the first one being bearish, the second one being a doji, and the third one being bullish.
Here, the first candle signifies a continuation of the downtrend, the second candle indicates market indecisiveness, and the third one is a bullish candle. Here, you will see that the second candle is generally much lower than both of the other candles and completely out of line with them.
Final Thoughts on Bullish Candlestick Patterns
We definitely recommend taking a closer look at bullish candlestick patterns as well as bearish candlestick patterns. Being able to identify wide variety of Candlestick patterns will automatically make you a much better and more proficient trader.
CLICK BELOW TO JOIN INCOME MENTOR BOX AND START MAKING REAL PROFITS!

For more trading tips, strategies, methods, and everything in between, check out Andrew’s Trading Channel. Here you will find the world’s best stock market trading school, a trusted day trading school, state of the art indicators and trading tools, Forex and crypto signals groups, and more!