Important Support & Resistance Secrets
Using support & resistance in trading can be very profitable, as these areas can be strong indications of a coming price reversal. That being said, S&R is not as straightforward as some might assume. There are some really important secrets of support & resistance that you probably don’t know, secrets that no one else is going to tell you about.
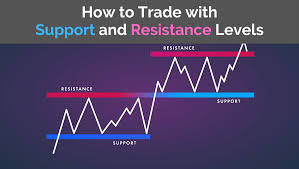
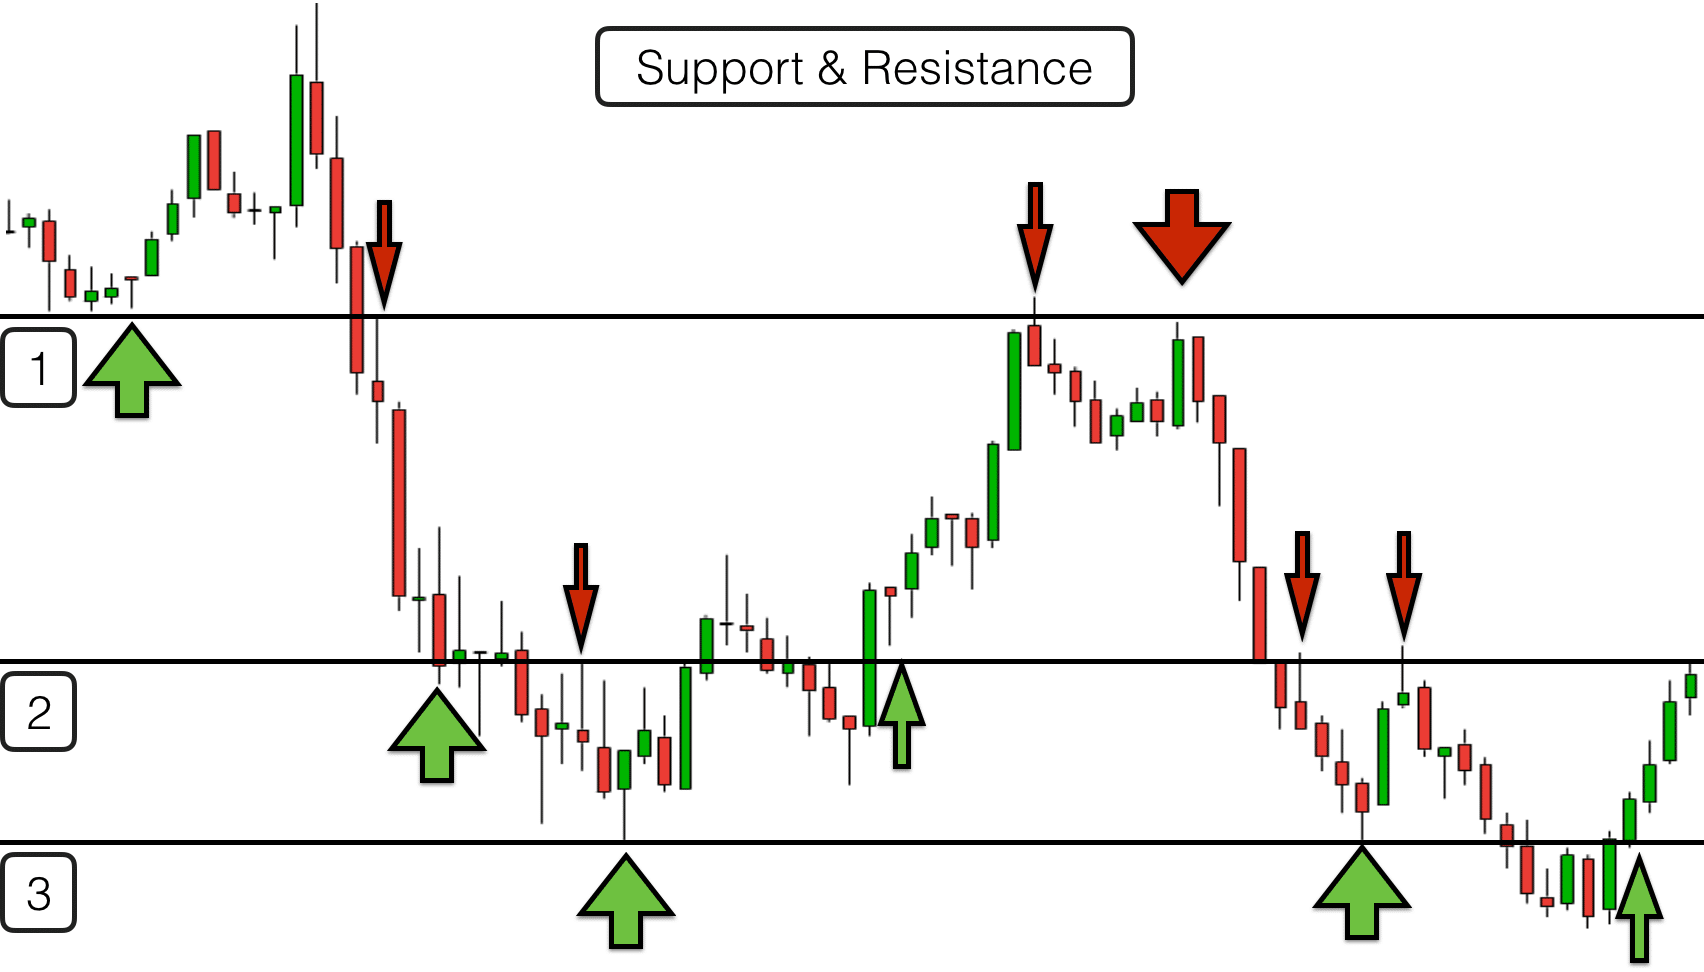
S&R are Areas, not Lines
One of the biggest mistakes that newbie traders make when using support and resistance in their trading setups is to assume that they are lines on the chart. Ok, so yes, you see resistance and support in terms of lines. They are lines drawn on the chart.
However, the mistake here is to assume that prices will adhere to the exact pip which one of those lines passes through. You might see a price breach a line of support or resistance and assume that a breakout is in the works, when in fact, just after the assumed breakout, the price reversed back in the other direction.
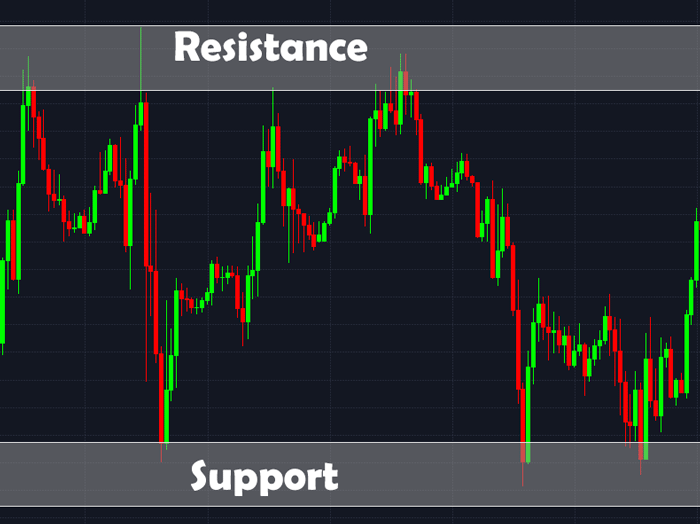
You need to realize that both support & resistance are areas of the chart, more like estimations rather than exact figures. Sure, those lines are always on the chart, but you cannot take them literally. It’s a “give or take” kind of thing, and there is always a margin of error to speak of.
The lines you see on the chart cannot be taken for their exact value as displayed. If you see a line of support, you can assume that the area of support may be somewhere a few pips above or below the displayed line. While support & resistance is very useful, those lines you see on the chart cannot be taken as exact measurements, more like educated guesses.
Support & Resistance Become Weaker the More They are Tested
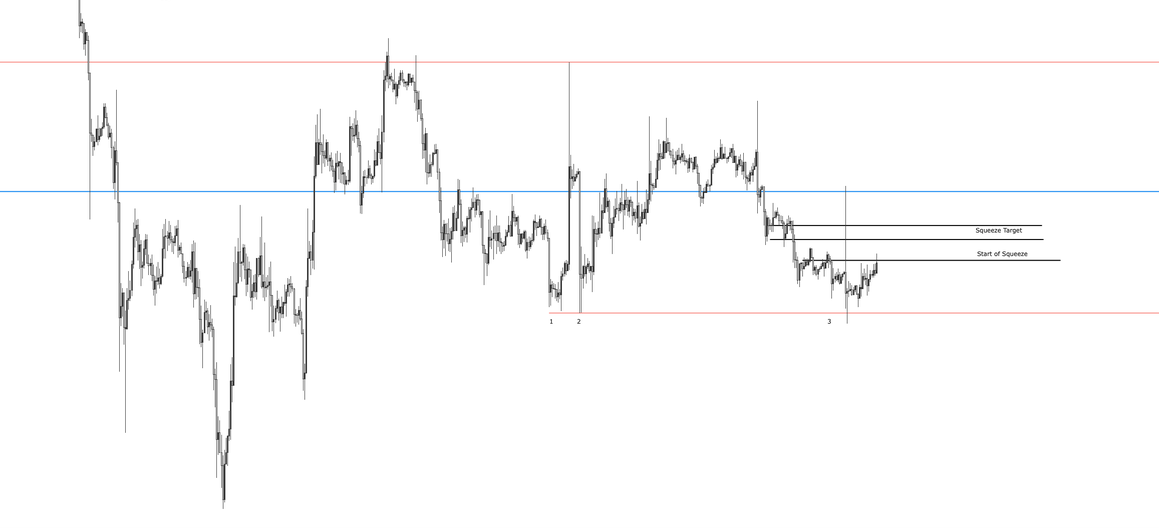
Most educational resources for trading will tell their students that the more times levels of support and resistance are tested, the stronger they become. Folks, this is not true, not at all, and in fact, the exact opposite is the case, especially when short time periods are involved. When resistance and support levels are tested many times within a short time period, they actually tend to become weaker, not stronger.
Let’s go over an example. Let’s keep in mind that support levels exist due to pressure from the buyers existing around a certain price point. When the price tests a specific support level multiple times, particularly in short period of time, orders start to fill up.
After a certain amount of time, when those orders fill up, there’s no one left who wants to buy, and thus, support will be broken. Orders are unlikely to be refilled so quickly, which is why the more times S&R levels are tested within a short period of time, the weaker they become, and the more likely they are to break.
Support & Resistance Represents an Area of Value, but There are Others Too
Something to keep in mind here is that the price of something is what you pay for it, whereas the value is what you actually get. For example, when you go shopping, you might pay $5 for a box of cookies. That’s the price.
The value you get out of those cookies, besides your own enjoyment, is not having to grow and process all of the ingredients. In layman’s terms, the price you pay for something needs to be less than the value that you get for it. If this were not the case, then there would be no transactions.
In relation to trading, this means that you could enter a trade at a specific price level, which is what you pay, but this does not mean that you will get value out of it. Therefore, finding areas of value is essential for trading.
For example, an area of value on a chart would be support, where potential buying pressure can push the price higher. There is no guarantee that this support will hold, but if it does, the price can reverse higher and provide you with fair value.
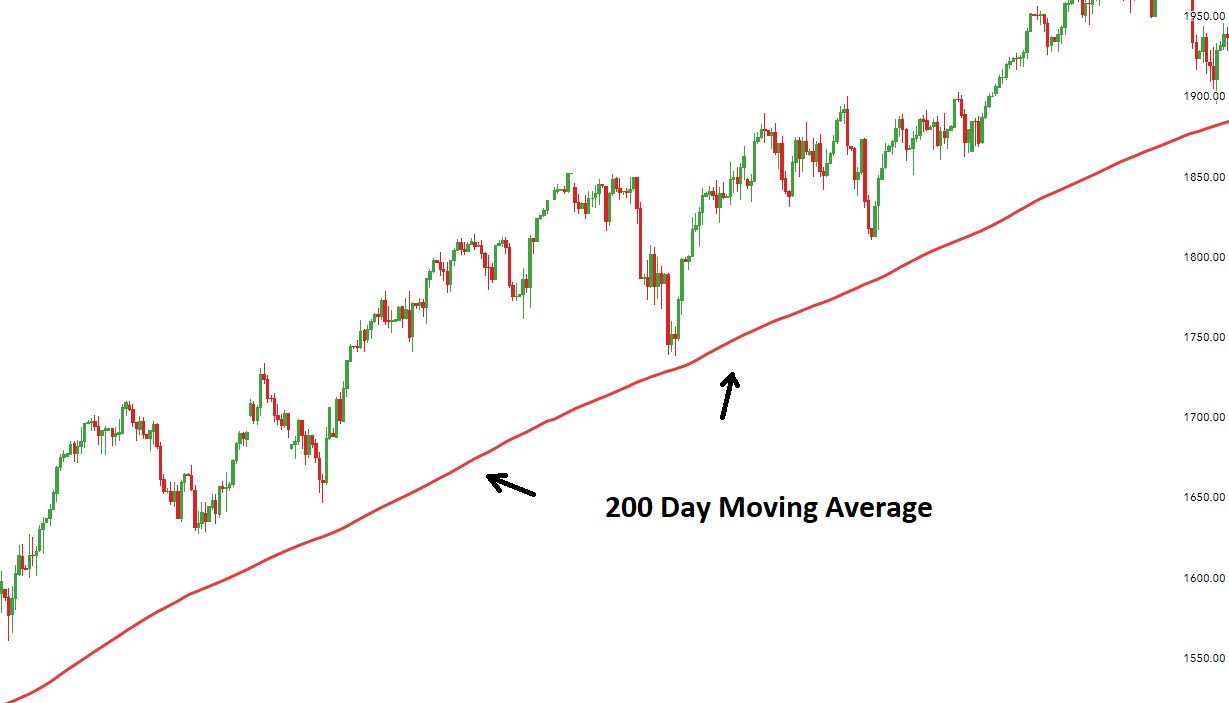
The important thing that we want to note here is that while support & resistance is a good way to define an area of value, it is not the only way to do so. Moving averages, trendlines, and other such tools can all be used to define areas of value. Don’t forget this.
Trading Around S&R Offers a Great Risk to Reward Ratio
Something that you never want to do is to execute trades when the price is split between support and resistance. If the price is too far away from either of these levels, your stop loss has to go below the support or above the resistance, and that’s way too far away from the original entry price.
You always want to trade when a price is approaching an area of value, such as an area of support or resistance. It is much easier to set a proper stop loss and take profit target when you enter a trade near an area of value such as support and resistance. It’s all about where you enter a trade, and doing so near an area of value is always best.
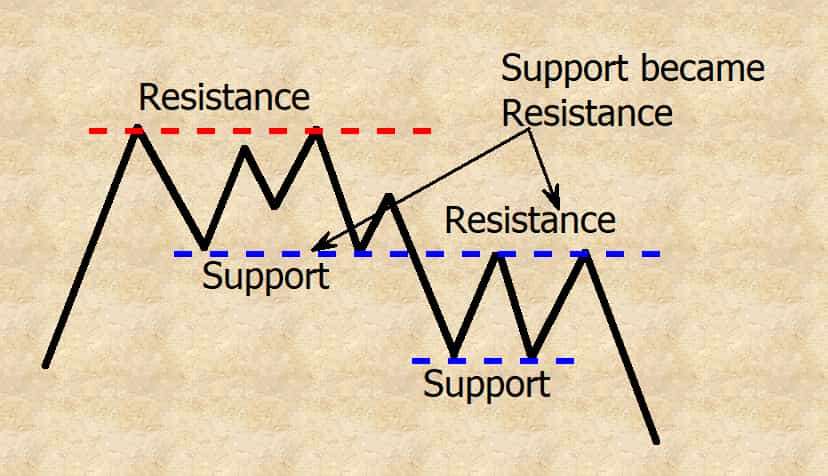
Support Can Become Resistance
Something that no one tells you is that support can become resistance, and vice versa. Yes, support is an area where buying pressure could push the price up, but support can break, and when it does, long traders will lose money.
There are stubborn traders who may hold onto their positions in the hopes that the price will reverse again, mainly back to the entry price so they can break even. However, this will then also create resistance at the entry price, thus effectively turning support into resistance. This can also happen the other way around.
Secrets of Support & Resistance – Final Thoughts
There you have it folks, 5 secrets of support & resistance that no one else tells you about.
To learn more about other forms of technical analysis, check out this article on Technical Analysis for Beginners.