Technical Analysis for Beginners
When it comes to trading Forex, stocks, cryptocurrencies, and anything in between, one thing that you absolutely must master is technical analysis. Technical analysis is all about figuring out if a market is overpriced, what trends are happening, and where good entry levels for trades occur.
Sure, might sound easy enough, but there is actually a whole lot that goes into technical analysis. This type of analysis in trading involves the use of charts and chart patterns, candlesticks, moving average, and many other indicators.
Today, we want to go over an explanation of what exactly technical analysis is, what it involves, and what its benefits for trading are.
Understanding Technical Analysis – The Basics
To provide you with a basic definition, technical analysis is the study of historical price action, with the aim of identifying trends and patterns, and to determine the probabilities of future price movements in a given market. This is done through the use of technical studies, indicators, and a variety of other analysis tools.
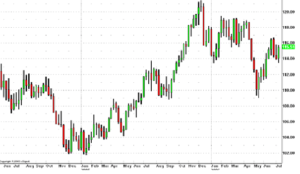
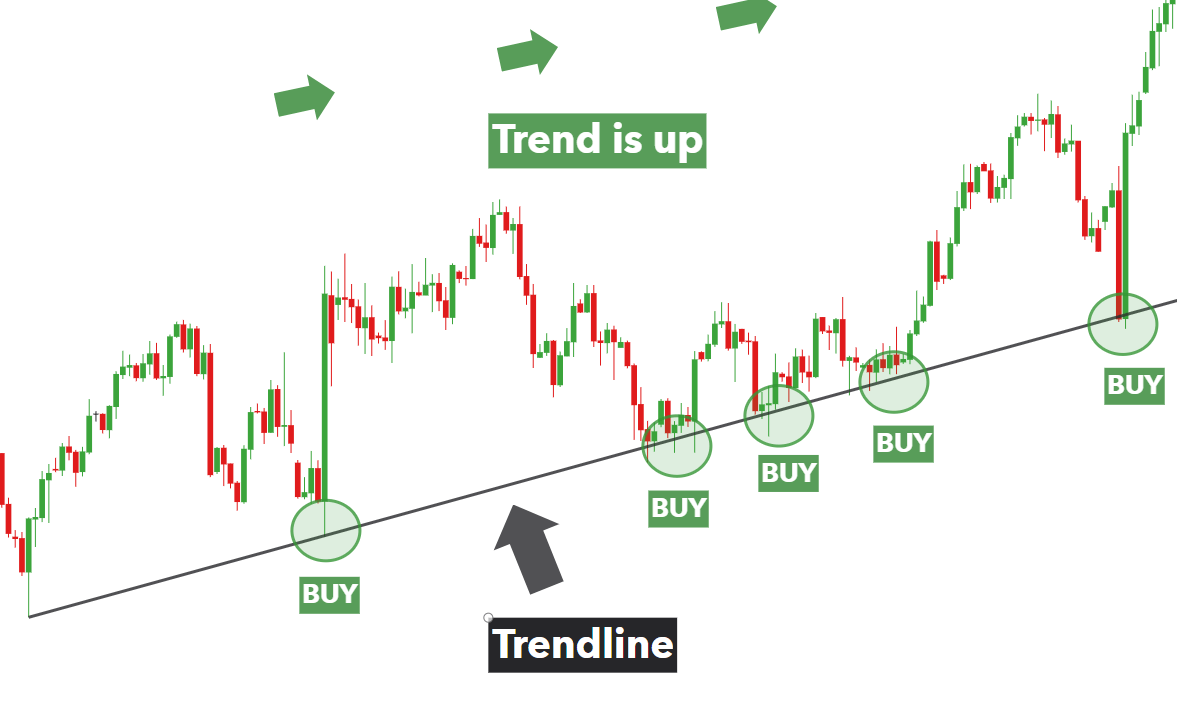
If we were to sum it up, technical analysis has two main goals. Goal number one is to identify a trend. Goal number two is to identify areas of support and resistance through the use of price charts, various time frames, and indicators. Remember that markets can only do 3 things. They can move, they can move down, and they can move sideways.
The Advantages of Technical Analysis Tools
You might be wondering why exactly you would use technical analysis for trading. Well, right now, let’s talk about the 5 main advantages that you get by using this type of analysis.
Identifying Trends
The first benefit that you get from doing technical analysis is that it can help traders predict trends in various markets. With the help of tools such as charts and indicators, figuring out whether a market is trending upwards, trending downwards, or moving sideways, is quite easily done.
Finding Entry & Exit Points
The next big advantage that comes your way with this type of analysis is that it can help you time your trades right. The whole point is to maximize returns by winning trades, and this is done by finding and taking advantage of the best entry points and exit points. Using indicators such as candlesticks, moving averages, the Elliot Wave, in combination with charts, traders can find the best times to enter and exit trades.
Getting Signals Early
Yet another big advantage that comes with using technical analysis in trading is that it helps provide you with early signals which indicate what the trading psychology in a given market is like. This type of analysis can also provide you with early warning signs of a looming trend reversal.
Simple, Quick, & Cheap
Something else that can be said here is that technical analysis is very quick and cheap to perform. There are tons of free charting solutions out there that come with all of the time frames and indicators you need to perform this analysis. This is opposed to fundamental analysis, which can be much more expensive to perform, not to mention more time consuming as well.
It Provides Tons of Information
What’s also really neat about this form of market analysis is that it can be used for many different kinds of trading including day trading, swing trading, short term trading and for long term investments too. Technical charts provide traders with a whole lot of useful information. Aspects such as support, resistance, chart pattern, momentum of the market, volatility, and trader’s psychology are just a few examples of the type of info that you can get from this sort of market analysis.
Some Technical Analysis Indicators to Know
In order to perform technical analysis, you do need to use some good technical indicators. The point here is that you want to use the best technical analysis indicators possible. The following indicators are the ones most commonly used.
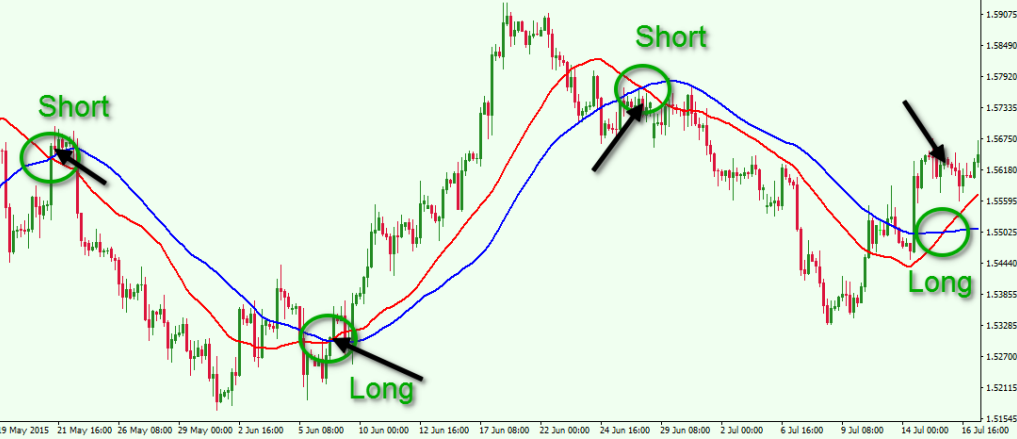
Moving Averages
Moving averages are known as leading technical indicators and they are designed specifically to identify breaks in price actions, as well as to identify the general direction of the market. In terms of how they look, they consist of a line drawn on a chart, which is then used to gauge the average value of a Forex pair over a certain period of time, whether 14 or 100 days. Keep in mind that moving averages used over a smaller amount of time feature a faster reaction speed to price changes.
Oscillators
Oscillators are used in Forex trading to identify the moment when a market reaches a limit and a trend reversal is set to happen. When a price goes up too high, analysts will assume that the market is overbought, which usually means that the price will either stay stable or reverse in a downward direction. On the other hand, when a negative correction occurs, new traders will enter the market, which generally results in a price increase. Generally speaking, it is best to buy oversold Forex pairs and to sell overbought Forex pairs. Oscillators may also be used to forecast a breaking point in the price movement of a certain market.
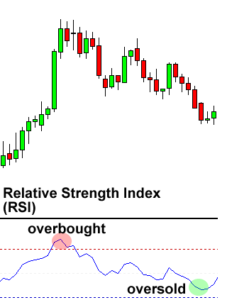
Relative Strength Index
The relative strength index is a type of oscillator that can be used to find various conditions in markets that are either overbought or oversold. This is very useful for traders who’s aim is to sell high and buy low, which is due to the fact that values on the chart are plotted between 0 and 100, with zero being oversold and 100 being overbought.
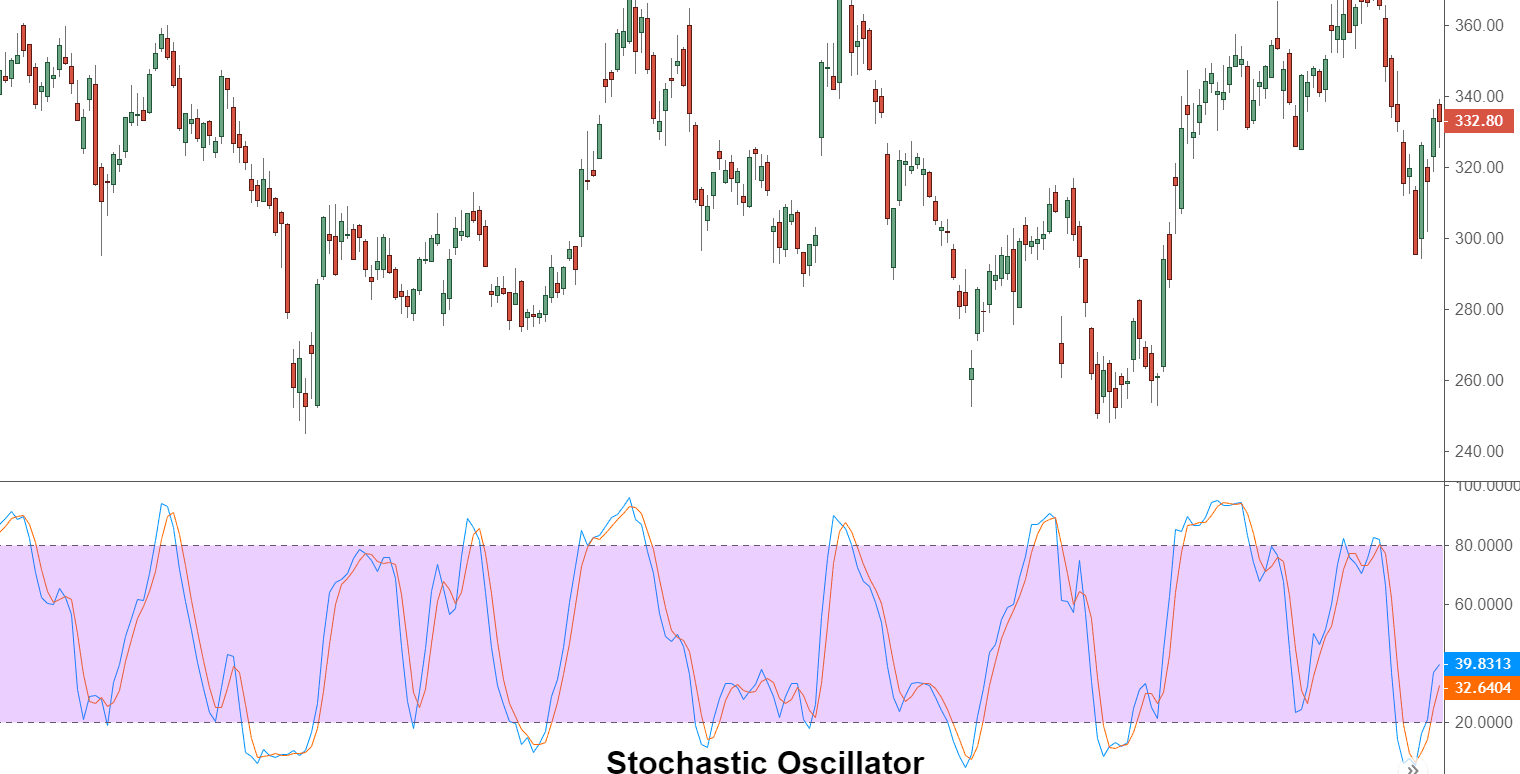
Stochastics
Yet another type of oscillator, stochastics is also used to identify overbought and oversold markets, but can also identify areas of possible price reversals. There are many versions of stochastics, but the most commonly used one is the slow stochastics. These are fan favorites because stochastics tend to be extremely accurate.
Technical Analysis – Final Thoughts
Folks, there is of course a lot more to technical analysis than what we have covered here today, but these are the basics. In the coming weeks, we will be covering this topic in much greater detail.