The Moving Average Indicator
You want to start trading Forex cryptocurrencies. The stock market or anything in between. Then one of the most important things that you need to study are trading indicators. When it comes to trading indicators, one of the most important ones that you need to know is the moving average indicator. Now in case you have no idea what moving averages in trading are, no worries because this is what we are here to explain today.
One of the things that we are here to talk about today is what type of indicator the moving average is and exactly what it has the ability to tell you. Moreover, you may also need to be aware that there is more than one type of moving average indicator out there. The two main types that we are here to discuss today are the simple moving average and the exponential moving average indicators.
These are two very similar indicators that provide you with the same type of information, although they do have differences between them that you, as a newbie trader, definitely need to know about. The main thing that we are here to do today is to compare simple and exponential moving averages to each other to see which one is best used in specific situations. Let’s get right to it and answer all of your most pressing questions about simple and exponential moving averages.
What is the Moving Average Indicator?
Before we can get to talking about the different types of moving average indicators, we do need to first discuss what it is in general. Now moving averages can be used in a variety of trading markets. Whether this be the Forex market, the cryptocurrency market, the stock market or commodity trading, or anything in between.
Another important thing that you need to know about moving averages is that they fall within one of the four categories of trading indicators that exist today. Just in case you didn’t know the four types of trading indicators out there include volatility, momentum trend and volume indicators, each of which tell you something different about a specific security or asset.
When it comes to those four types of indicators, moving averages fall within the trend indicators category, or in other words, they have the ability to tell you. in which direction the value of a security or asset is moving, or in other words, whether it is trending upwards in value or downwards.
Although moving averages technically are not momentum indicators, if you know exactly how to read this type of indicator, it can also inform you of the momentum of that trend, at least to a certain degree.
Two Types of Moving Averages
OK, so we did mention that there are two main types of moving averages and these are exponential and simple moving averages. Now they are of course quite similar and they do provide you with information in relation to the trend of a specific security or asset.
However, with that being said, these two types of trend indicators do function in slightly different manners and this is very important for you to know. You need to know what the SMA indicator tells you and what the EMA indicator tells you, so you can actually trade profitably, so let’s take a closer look at both right now.
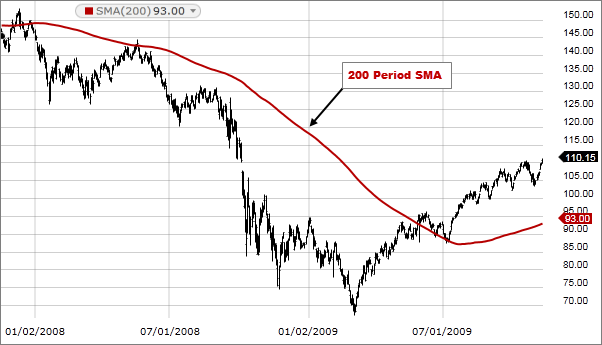
The Simple Moving Average
The first of the two types of moving averages that we want to look at is the simple moving average, and as you can probably assume, based on its name, it is the simpler of the two types. The most basic definition of this type of MA is that it provides you with the information on the average price within a selected time period or range.
In other words, it’s nothing more than the addition of closing prices of various days, which are then divided by the number of days. This is a technical indicator that will tell you in which direction the price of an asset is moving. Or in other words, if the price of an asset will continue to rise, or if it will reverse in the near future.
To put this in layman’s terms, the simple moving average can help you determine whether or not there is a bull market on the horizon or a bear market. It’s a simple yet effective trading indicator that Forex traders, stock market traders, cryptocurrency traders, and commodity traders can use.
Now the big benefit of the simple moving average is that it provides you with a very smooth line that is not prone to whip signing up and down. It is not acceptable to providing you with false signals due to small or temporary price swings. Moreover, the simple moving average is ideal for longer periods of time.
However, the main drawback with this type of moving averages that it’s responds very slowly to rapid price changes that can often occur at reversal points. Due to the fact that the SMA is very slow to respond, it doesn’t work all that well for short time periods.
Calculating the SMA
What’s nice about calculating the simple moving average is that all you have to do is add together the closing prices of an asset and then divide it by the number of days that you added up. Below we have provided a very simple example of exactly how this is calculated.
$3 + $4 + $5 + $6 +$7 = $25
25 / 5 = 5
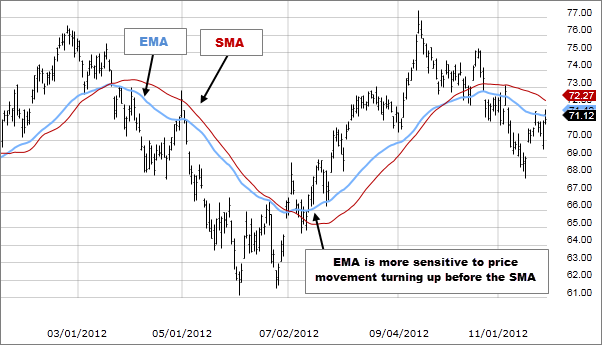
The Exponential Moving Average
The second type of the moving averages that we need to discuss is the exponential moving average for EMA, and as you can probably guess by the name of it, it is the more complicated of the two. The exponential moving average is another type of technical chart indicator that is all about tracking the price of stock, commodity or even a currency pair based on a specific time frame.
Yes, this is also a trend indicator that can tell you in which direction a security is trending, and it can also provide you with a bit of information about the momentum. What you need to know here, however, is that the exponential moving average is a weighted moving average, which means that a lot of weight is given to the most recent price that is used in the calculation, or in other words, to the price of the most recent day.
Because the EMA puts more importance on the most recent prices used in the calculation, it therefore works well for short time periods. In other words, because the most importance is placed on the most recent prices, the TMI therefore, responds very quickly to the most recent price changes and is therefore ideal for providing you with accurate short term signals. For this reason, the exponential moving averages also better than the SMA for calculating short-term trend reversals.
With that being said, because this type of moving averages puts so much weight on the most recent prices, it therefore does not work well for long time periods. And it is also susceptible to whip sawing up and down due to temporary price changes. This type of moving average indicator can provide false signals, so it really doesn’t work well on short time periods.
/EMA-5c535d5a46e0fb000181fa56.png)
Calculating the EMA
Calculating an EMA is not very easy, and it does require a few steps, so we will do our best to explain this in the simplest terms possible.
- In order to calculate the EMA , you first need to obtain the SMA for a specific period of time. For instance, if you have a 20 day time period, you need to calculate the SMA for that period, and then, on the 21st day, you can use the SMA of the previous 20 days as the first EMA for yesterday.
- You must then also calculate the weighting or the smoothing factor for the EMA, which is [2 / (number of observations) +1], which in this case would be [2/(20+1)] = 0.0952.
- The final step of the calculation of the EMA is EMA = closing price x multiplier + EMA of previous day x (1 – multiplier).
Of course, this is a bit complicated for newbies, but with that being said with a little bit of practice he should be able to master calculating an exponential moving average with relative ease.
FAQs
- What’s the 20 EMA?
The 20 MA is usually considered to be one of the best moving averages to use for daily charts because the price follows it very accurately during a strong trend.
- What is the Best EMA for Day Trading
The two best EMAs to use for day trading, especially for short term investments, are the 8 day and 20 day EMAs.
- What is the Best EMA for Forex?
Depending on your goals, the best EMA time frames to use for Forex include 5, 10, 12, 20, 26, 50, 100, and 200 day time frames.
All About Moving Averages – Final Thoughts
Now that you know all about MAs, you can choose whether to use a simple moving average or an exponential moving average as your trend indicator of choice. And yes, with that being said, moving averages or excellent trend indicators that you should definitely learn how to use.
If you need help day trading, and what you need is a comprehensive education, particularly on Forex trading, then the best place to be is the Income Mentor Box Day Trading Academy. At this time, the IMB Academy is the most comprehensive, user friendly, effective, and affordable Forex trading school out there.
CLICK BELOW TO JOIN INCOME MENTOR BOX AND START MAKING REAL PROFITS!
![]()