Trading with the MACD Indicator
If you want to start trading forex crypto currencies, the stock market, and everything in between, then you might not know where to get started. Now, when it comes to trading, one of the most important things that you need to know about are indicators. In day trading, technical analysis indicators provide you with a variety of useful information that will allow you to make profitable trades in terms of the best technical analysis, trading indicators out there, the MACD indicator is one of the most important.
In terms of the most useful technical analysis tools out there, the MACD indicator is definitely at topical list because it has been building to provide you with many different types of information about the price of the security. Or asset.
In case you do not know what the MACD indicator is, how it works. What it can tell you or how to calculate it then you don’t have to worry because this is exactly what we are here to explain to you today. Let’s get right to it and teach you everything that there is to know about this MACD indicator, so you can start making consistent profits.
What is MACD?
Alright, So what we want to do right now is to provide you with a basic definition of exactly what this MACD indicator is. Alright, so first and foremost, this is of course an acronym and it stands for moving average convergence divergence. Of course this does sound like quite the mouthful, and it does sound like it is fairly complicated, but in all reality it’s actually quite a simple indicator because all it does is measure the relationship of exponential moving averages with each other.
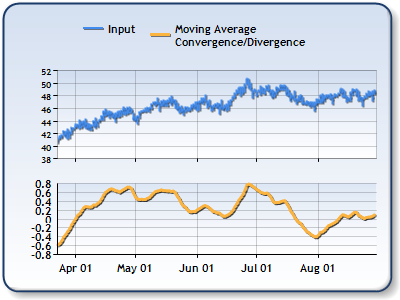
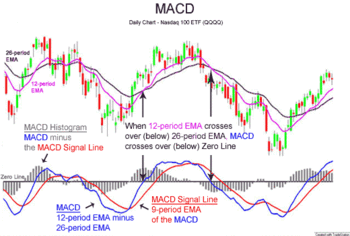
If you attach this particular indicator to a chart, and you take a look at it, you will see that there are three clear lines displayed. There is a blue line which is the Ma CD line. There is a signal line which is a red line and there is a green line which is the histogram. The main point of the MACD indicator is to illustrate for you the differences between the signal line and the MACD line.
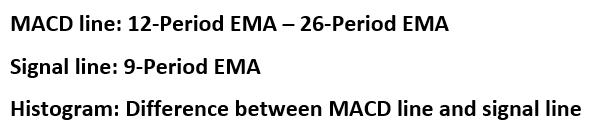
If we were to get really technical about it, the moving average convergence divergent indicator is actually the difference between two moving averages that have been exponentially average along the 12 day and 26 day periods. With the signal line usually taking on the form of a nine period exponentially smoothed average of the moving average convergence divergence line.
The other important thing that you need to know about this particular day trading indicator is that it does also function kind of like an oscillator, and this is because it can provide you with both oversold and overbought signals, which are shown either below or above the zero line. With that moving average convergence, divergence lines usually wavering around that same zero line.
What the MACD Indicator Tells You
Now, one of the absolute coolest parts about this NACD indicator is the fact that it actually provides you with two different types of information. What you need to know here is that, generally speaking, indicators are divided into four different categories. These categories include trend indicators, momentum indicators, volume indicators and volatility indicators.
For the most part, indicators usually only provide you with one of these four types of information ,but the moving average convergence divergence Indicator is a little bit different in the sense that it actually provides you with information on two of these prints. The MACD indicator is actually both the trend indicator and a momentum indicator, thus automatically making it one of the most useful day trading analysis tools out there. Below we have told you exactly how to read the MACD indicator and what it tells me.
- When the MACD line crosses below the zero line, it signals that the asset is in a downtrend and traders will usually take this as an indication to place sell trades.
- When the NACD line crosses above the zero line, it signals that the asset is in an uptrend and traders will usually take this as an indication to place by trades.

Moving Average Convergence Divergence – Pros & Cons
OK, while this is indeed one of the most useful day trading indicators and technical analysis tools out there, what you do need to know is that just like with any other indicator, there are both advantages and disadvantages to using moving average convergence divergence.
Pros
- By far the biggest advantage that you get with this particular day trading indicator is the fact that it provides with information on both trends and momentum.
- Yet another advantage that you get here is that when you use the MACD crossover and divergence, it is an indicator that can provide you with extremely accurate and clear buy and sell signals.
- What’s also cool here is that this indicator can be used along with other day trading tools and indicators. For added clarity and accuracy.
Cons
- What is not so great about the MACD indicator that it may provide you with false signals, especially when it comes to signal reversals. Sometimes something might look like a signal reversal, but it’s actually just a pause in a trend or a sideways movement.
- Sometimes the moving average convergence divergence indicator doesn’t provide you with 100% accurate analysis of trends. Sometimes these signals may not move before a trend reversal, and sometimes trend following signals made fail.
How to Calculate Moving Average Convergence Divergence
Let’s just provide you with a quick step-by-step instructional on exactly how to calculate the MACD.
- First, calculate the 12 period EMA for the price at a chosen time.
- Calculate the 26 period EMA for the price at a chosen time,
- Subtract the 26 period EMA from the 12 period EMA.
- Based on the result obtained in step 3, calculate a 9 period EMA.
What’s the Best Setting for MACD Day Trading?
Although the MACD is usually set to 12, 16, 9, if you are looking for the most accurate signals and the biggest profits, we recommend setting it to 5, 13, 1. However, if what you are looking for is great sensitivity, then set it to 5, 35, 5.
The Bottom Line on the MACD Indicator
When all has been said and done, the bottom line here is that the MACD indicator is hands down one of the very best day trading technical analysis indicators out there.
Remember people, if you need help day trading, and what you need is a comprehensive education, particularly on Forex trading, then the best place to be is the Income Mentor Box Day Trading Academy. At this time, the IMB Academy is the most comprehensive, user friendly, effective, and affordable Forex trading school out there.
CLICK BELOW TO JOIN INCOME MENTOR BOX AND START MAKING REAL PROFITS!
![]()